Positional Scoring Breakdown
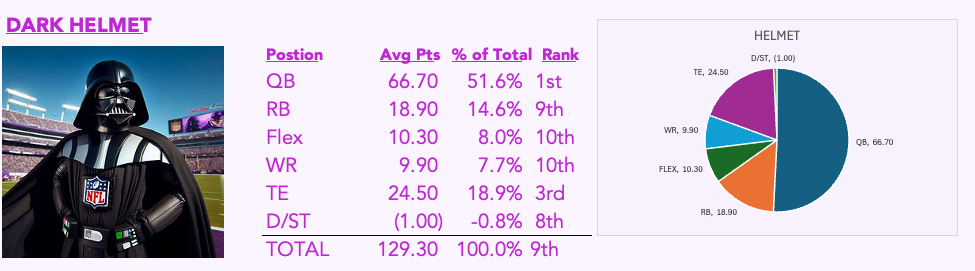
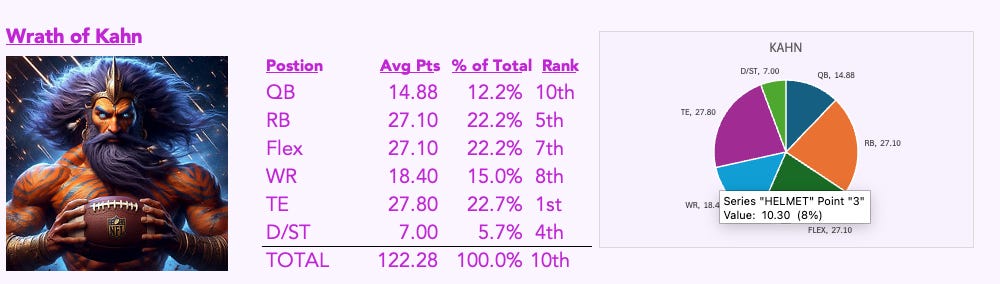
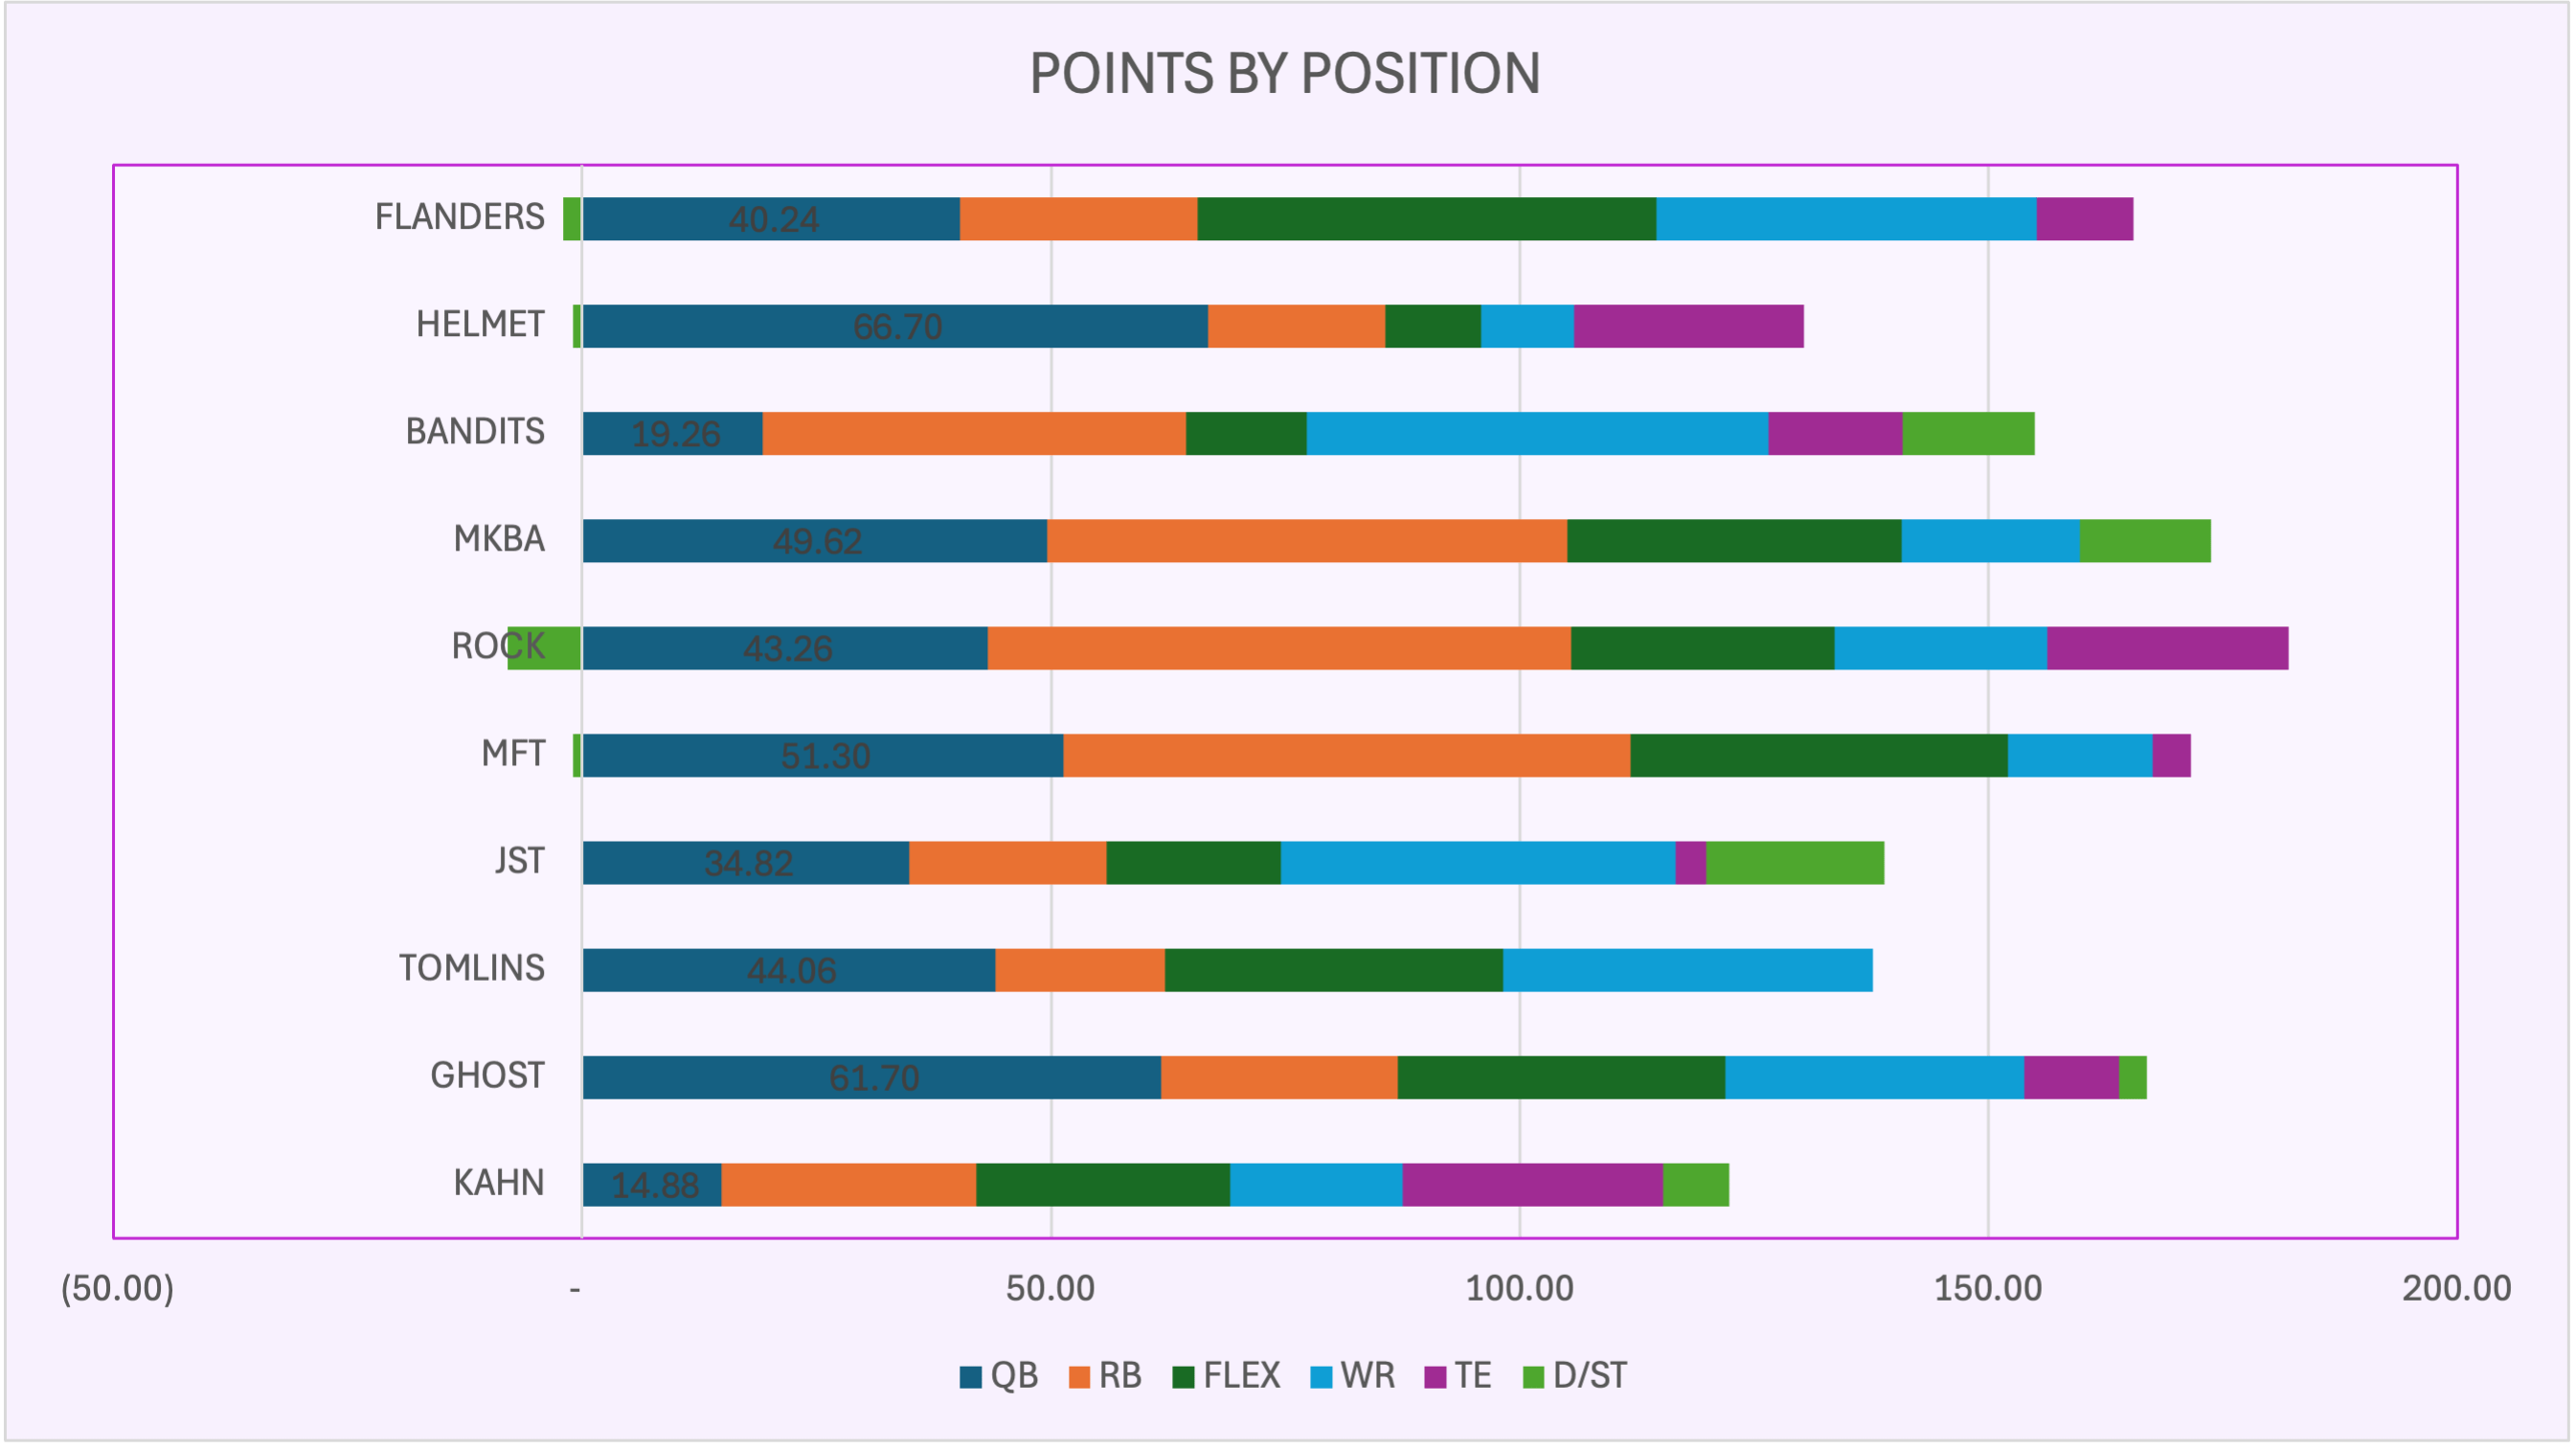
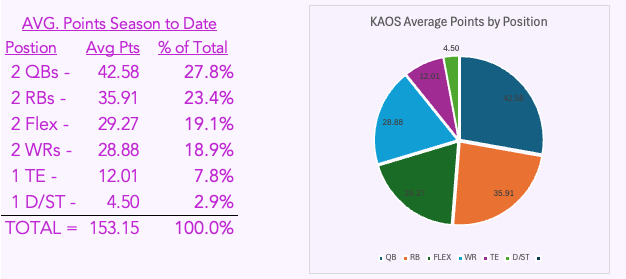
How well do you really know your fantasy team? Perception does not always match reality. To identify each team’s strengths and weaknesses, I compared the stats from every starting lineup across the league. These figures include only players who appeared in your starting lineup; they exclude any points those players scored while on your bench, as free agents, or on another team. The bar chart above shows the league-wide scoring breakdown by position. Based on the average weekly point total per team through Week 1, the positional breakdown is as follows:
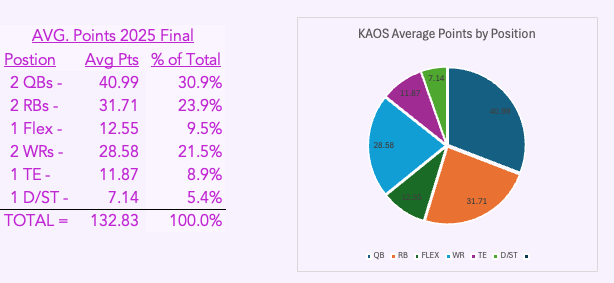
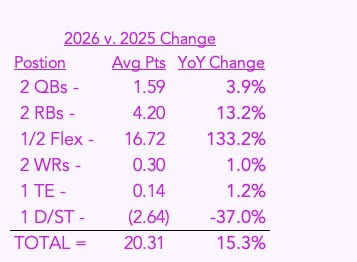
I will also compare this years data to the positional point breakdown from last season to illustrate how the new roster rules have impacted overall scoring. Through Week 1 average scoring is up 20.31 points a game, from 132.84/game in 2025 vs. 153.15/game this year. 16.72 of those points come from the additional flex position, 4.2 point increase in the RB spots and 1.59 point increase from the QBs. D/ST decreased by -2.64 points while WR and TE remain unchanged.
2025 Scoring Breakdown:
2026 Scoring Breakdown:
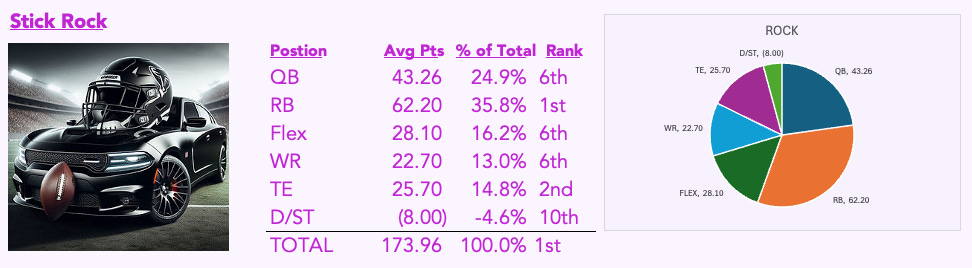
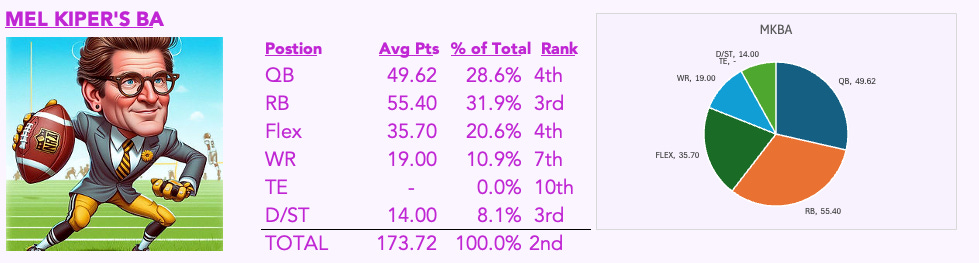
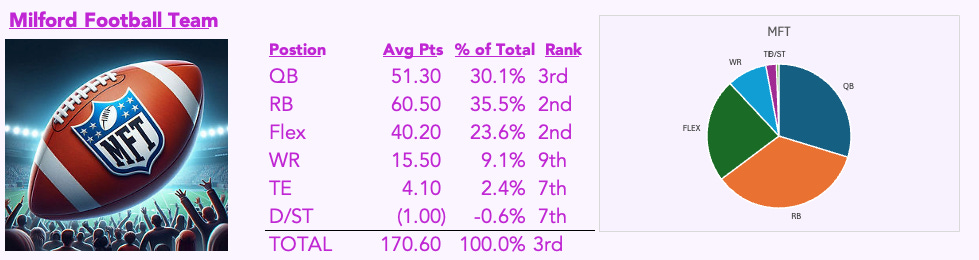
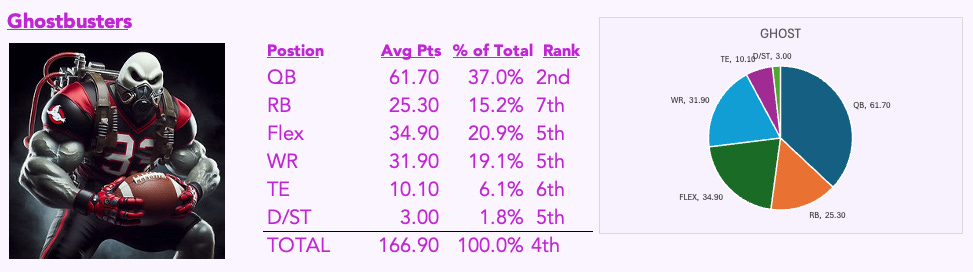
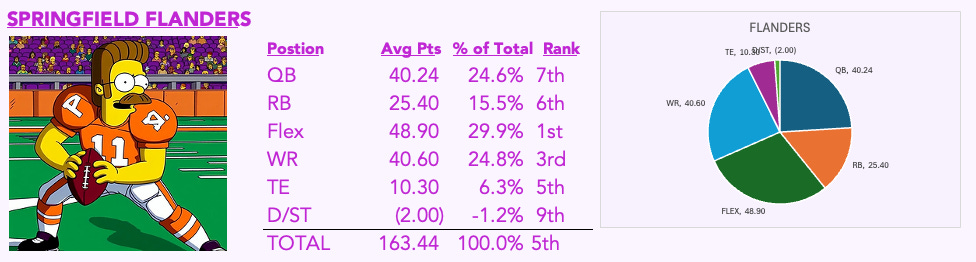
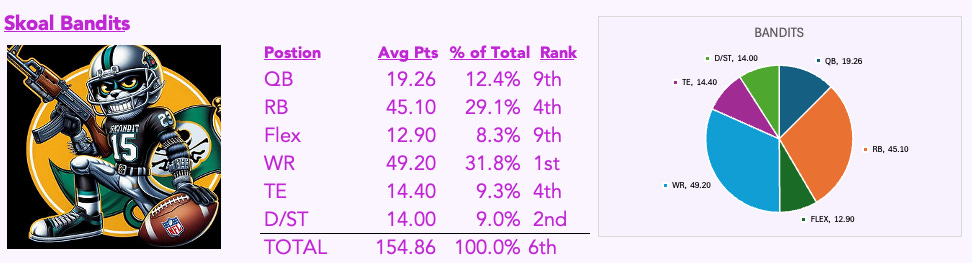
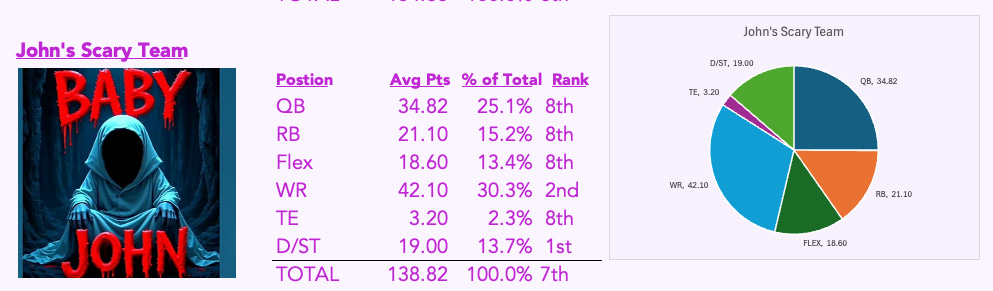
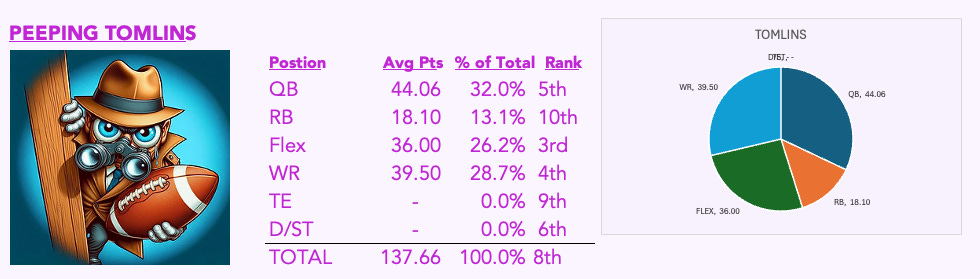
Each team has been ranked by their Average Total Points scored on a weekly basis, showing points by position and where that ranks compared to the rest of the league: