

2025 Luck Standings
Is your W/L record what it should be?

.jpeg")
No matter how much planning we do in Fantasy Football, a lot of it comes down to... LUCK. Injuries, contract hold outs, trades, and poor performances happen to every team. With that in mind, I have come up with the “Luck” rankings for the 2025 Season. Each team has been broken down into one of these three categories:
Lucky Teams
You are what your record says you are (neutral)
Bad Luck Teams.
The chart below summarizes the luck factor for each team based on scheduling. Term definitions are as follows:
Actual Win % is your current W/L pct.
All Play Win % is what your record would be if you played every team each week. For example, Milford Football Team had the 5th highest win total in Week 3. Therefore, his Week 3 Record would be 5-4 (Higher point total than 5 teams and lower point total than 4)
Variance is your actual Win % minus the expected win total based on all-play pct.
Actual Wins = Real Win total.
Expected Wins = All Win Pct X number of games played.
+/- win is how many wins you are over or under the expected win total.
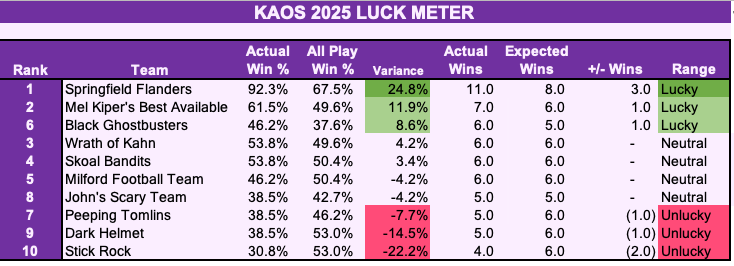
So according to this chart, Flanders had the luckiest team in the league this season. They currently have a .923 winning percentage but if you stack up their point totals for each week and compared it to the rest of the league, their all-play percentage would only be .675. That has led to three additional wins then they should have based on performance.
On the other end of the spectrum we have Stick Rock. Their actual win total is two less than expected.